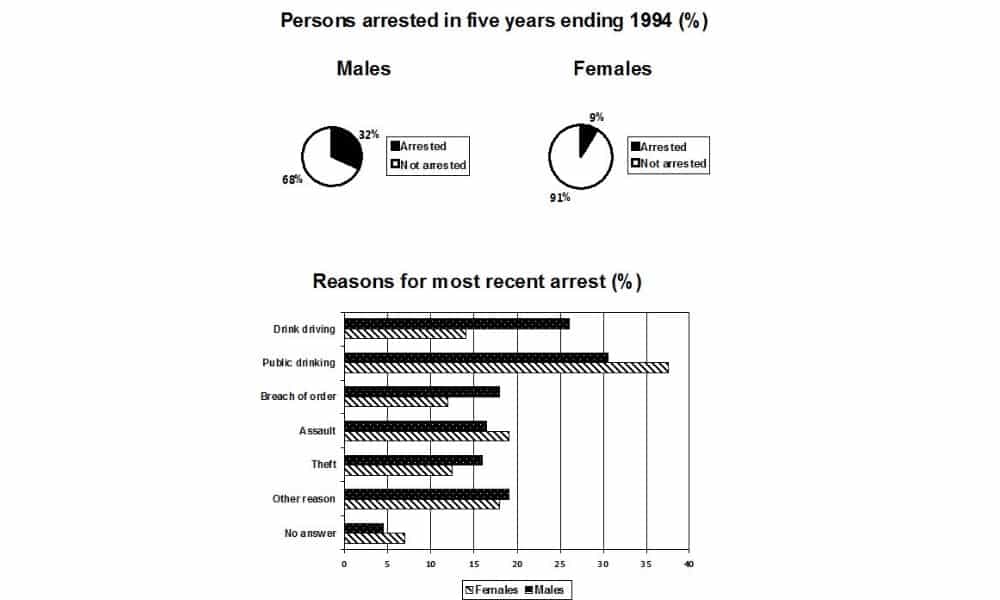
The pie chart shows the percentage of persons arrested in the five years ending 1994 and the bar chart shows the most recent reasons for arrest.
Sample Answer of The pie chart shows the percentage of persons arrested in the five years
The given pie and bar chart illustrates the proportion of arrested both gender criminals and the reasons for arresting the criminals in 1994.
Overall, A significant proportion of male and female was not arrested in five years while public drinking was the main reason for arresting throughout the Time Period.
Moving onto the details, A significant proportion of female was not arrested in 1994(91%). The proportion of arrested women was noted as 9% while the proportion of arrested males was almost four folds more than women.
Moving further, the figure for women and men was arrested due to drinking noted as almost 35% and 25%. The proportion of men arrested due to assault and theft was higher was similar(18%). The number of men and women arrested due to other reason was almost similar. The higher proportion of men who were arrested during drink drinking was noted as 20% while the percentage of women almost half compared to men.
Also, Follow us on our Facebook IELTSFever for more Updates
Not Enough Students Choose Science Subjects at University in Many Countries
Many Parents Complain About Violence Promoted to Their Children
Explain About a Phone App or a Computer Program That You Liked the Most.
There Has Been a Great Increase in the Number and Variety of Online

