ACADEMIC WRITING TASK 1

The Graph Gives Information About the Drinking Habits of the US

The Graph Gives Information About the Drinking Habits of the US

The graph gives information about the drinking habits of the US population by age. Summarise the information by selecting and reporting the main features, and make comparisons where relevant. Write at least 150 words Sample answer of The Graph Gives Information About the Drinking Habits of the US The bar chart illustrates the comparison of four […]

The Graph Gives Information About the Drinking Habits of the US Read More »

The Pie Charts Below Show the Percentage of Housing Owned

The Pie Charts Below Show the Percentage of Housing Owned

The Pie Charts Below Show the Percentage of Housing Owned and rented in the UK in 1991 and 2007. Summarize the information by describing the main features of the charts and making comparisons where appropriate. Summarise the information by selecting and reporting the main features and make comparisons where relevant. Write at least 150 words. Sample

The Pie Charts Below Show the Percentage of Housing Owned Read More »

The Diagrams Below Show the Design for a Wave-energy Machine

The Diagrams Below Show the Design for a Wave-energy Machine

You should spend about 20 minutes on this task. The diagrams below show the design for a wave-energy machine and its location. Summarise the information by selecting and reporting the main features and make comparisons where relevant. Sample Answer of The Diagrams Below Show the Design for a Wave-energy Machine The process chart reveals how to work

The Diagrams Below Show the Design for a Wave-energy Machine Read More »

How Coffee Is Produced and Prepared for Sale in Supermarkets and Shops

The diagram below shows how coffee is produced and prepared for sale in supermarkets and shops. Write a summary paragraph for the above diagram. Sample Answer How Coffee Is Produced and Prepared for Sale in Supermarkets and Shops The diagram illustrates the procedure of coffee production for sale. Diagram describes the different steps following for the process of preparation

How Coffee Is Produced and Prepared for Sale in Supermarkets and Shops Read More »

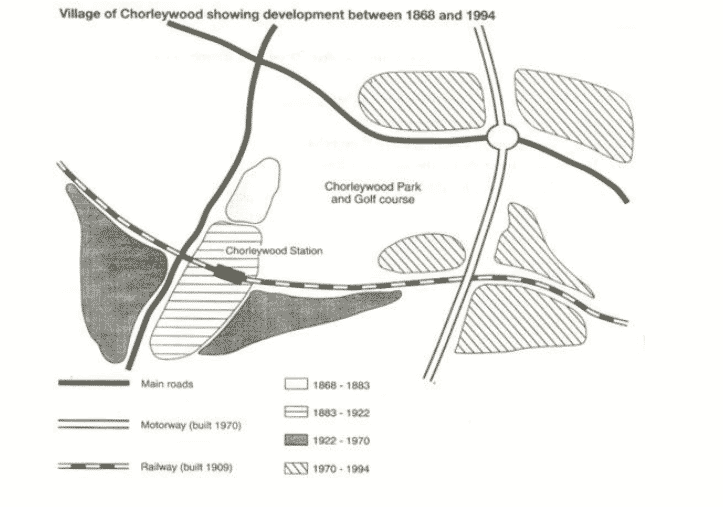
growth of a village called Chorleywood between 1868 and 1994.

The map shows the growth of a village called Chorleywood between 1868 and 1994. Answer of the Academic Writing Task The map shows the growth of a village called Chorleywood between 1868 and 1994. The figure shows the rising of a village named Chorleywood in 1868-1994. Development works in village were done in different periods

growth of a village called Chorleywood between 1868 and 1994. Read More »

The Charts Below Show the Results of a Survey of Adult Education.

The Charts Below Show the Results of a Survey of Adult Education. The First Chart Shows the Reasons Why Adults Decide to Study.

The Charts Below Show the Results of a Survey of Adult Education. The First Chart Shows the Reasons Why Adults Decide to Study. The Pie Chart Shows How People Think the Costs of Adult Education Should Be Shared. Write a Report for a University Lecturer, Describing the Information Shown Below. Sample Answer:  introduction: The bar

The Charts Below Show the Results of a Survey of Adult Education. Read More »

Pie Chart Shows the Percentage of Persons Arrested in the Five Years

Pie Chart Shows the Percentage of Persons Arrested in the Five Years

The pie chart shows the percentage of persons arrested in the five years ending 1994 and the bar chart shows the most recent reasons for arrest.   Sample Answer of The pie chart shows the percentage of persons arrested in the five years   The given pie and bar chart illustrates the proportion of arrested

Pie Chart Shows the Percentage of Persons Arrested in the Five Years Read More »

Numbers of International Students Attending the Sydney

The Chart Shows the Fluctuations in the Numbers of International Students Attending the Sydney International Language Centre in 2001.

The chart shows the fluctuations in the numbers of international students attending the Sydney International Language Centre in 2001. Sample Answer of Numbers of International Students Attending the Sydney The line graph expounds the information regarding the scholars who took enrolment in Australia‘s Sydney’s International Language Centre in 2001. Overall, the most eye-catching feature is

Numbers of International Students Attending the Sydney Read More »

Information About Changes in Modes of Travel in England Between 1985 and 2000.

Information About Changes in Modes of Travel in England Between 1985 and 2000. Year

The table below gives information about changes in modes of travel in England between the Year 1985 and 2000. Write in 150 words Sample Answer of Information About Changes in Modes of Travel in England Between 1985 and 2000. The tabular chart elucidates the information regarding the average distances that individuals in Britain travel using

Information About Changes in Modes of Travel in England Between 1985 and 2000. Read More »

Expert From a Different Country Recently Gave a Talk at the Club

You Are a Club Secretary. An Expert From a Different Country Recently Gave a Talk at the Club

You are a club secretary. An expert from a different country recently gave a talk at the club. Write a letter to thank him/her and say how club members enjoyed it. Include the following in your letter: – When and where did the talk take place? – Explain why the members enjoyed it. – Suggest another lecture

Expert From a Different Country Recently Gave a Talk at the Club Read More »

Scroll to Top