The Diagrams Below Show the Design for a Wave-energy Machine
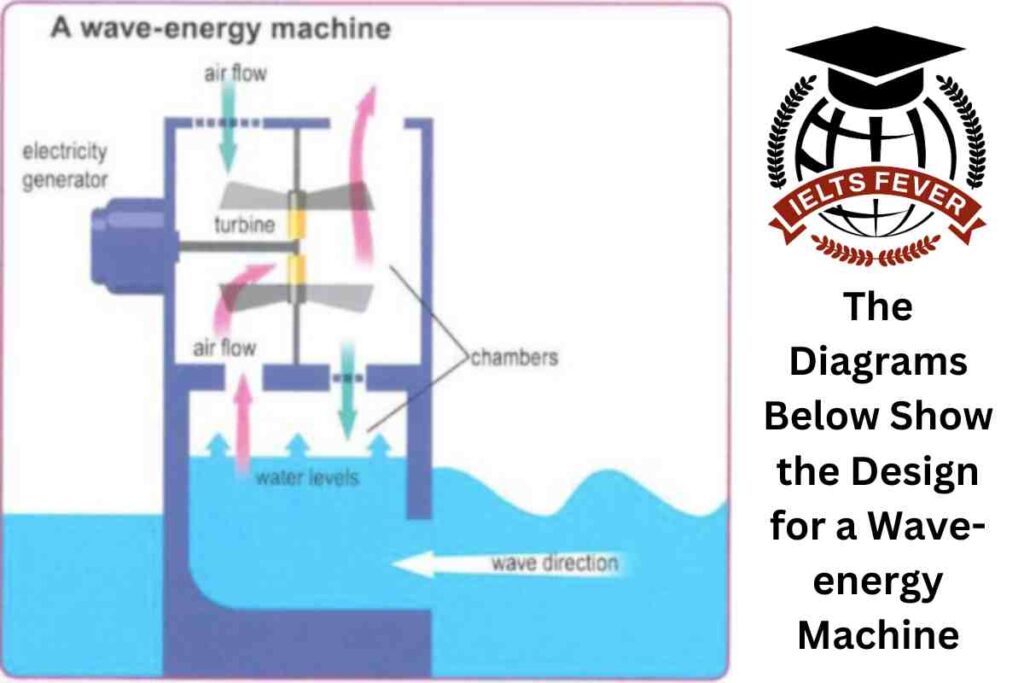
You should spend about 20 minutes on this task. The diagrams below show the design for a wave-energy machine and its location. Summarise the information by selecting and reporting the main features and make comparisons where relevant. Sample Answer of The Diagrams Below Show the Design for a Wave-energy Machine The process chart reveals how to work […]
The Diagrams Below Show the Design for a Wave-energy Machine Read More »