Post
The bar chart below shows the hours per week that teenagers
The bar chart below shows the hours per week that teenagers spend doing certain activities in Chester from 2002 to 2007. You should spend about 20 minutes on…
The bar chart below shows the hours per week that teenagers spend doing certain activities in Chester from 2002 to 2007. You should spend about 20 minutes on…
The Bar Chart Shows the Scores of Teams a, B, and C Over Four Different Seasons. Summarize the information by selecting and reporting the main features…
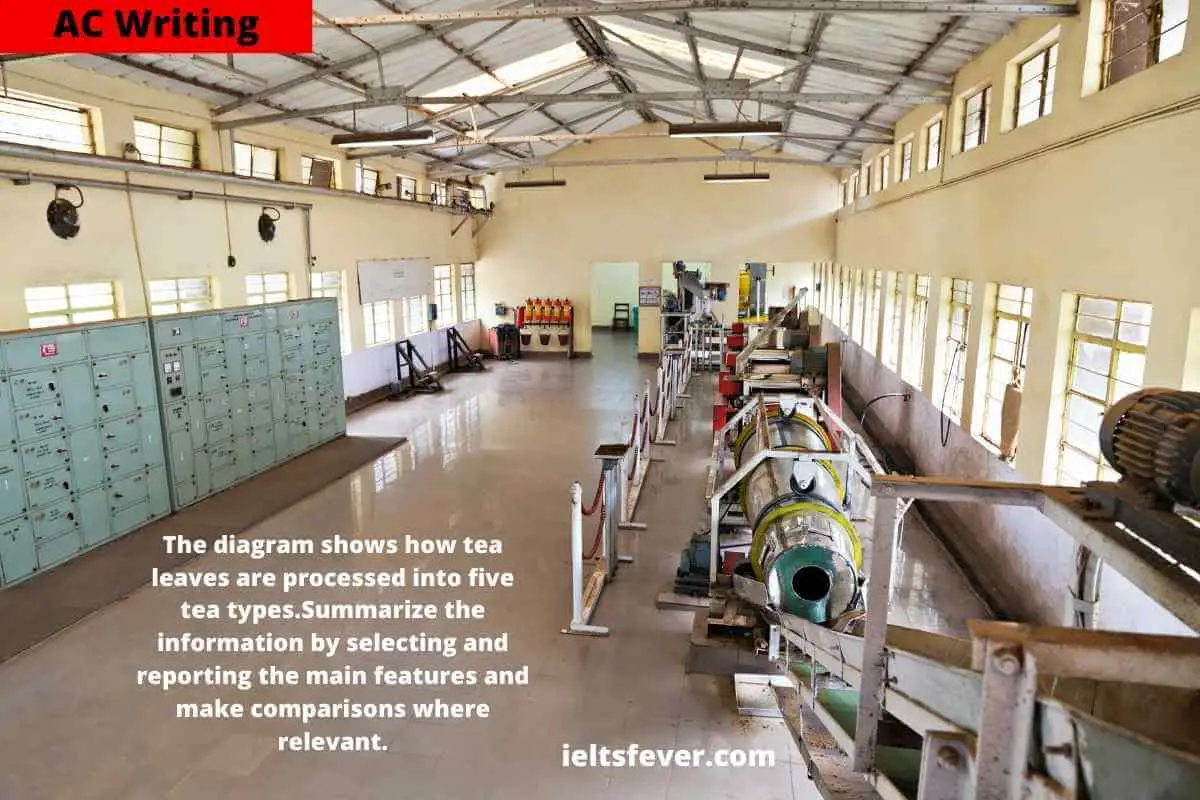
The Diagram Shows How Tea Leaves Are Processed Into Five Tea Types. Summarize the information by selecting and reporting the main features and make comparisons where…
The graph below shows the information on employment rates across 6 countries in 1995 and 2005. Summarise the information by selecting and report in the main features, and…
The pie chart shows the percentage of women in poverty and the bar chart shows poverty rates by sex and age. They are from the United States…
The line graph shows visits to and from the UK from 1979 to 1999, and the bar graph shows the most popular countries visited by UK residents…
The charts below show the percentage of food budget the average family spent on restaurant meals in different years. The graph shows the number of meals…
Your car insurance company has told you that they are going to increase the amount you have to pay in insurance for your car each month. You are…
The chart below shows the number of men and women in further education in Britain in three periods and whether they were studying full-time or part-time.…
The charts below give attendance figures for Grandville stadium from 2017 which are projected in 2030 after a major improvement project. write at least 150 words…
The bar chart shows the number of overseas students enrolled in a third-year Computer Science course at a Canadian college. Summarise the information by selecting and…
The charts summarise the weight measurements of people living in Charlestown in 1955 and 2015. Summarise the information by selecting and reporting the main features, and make comparisons…